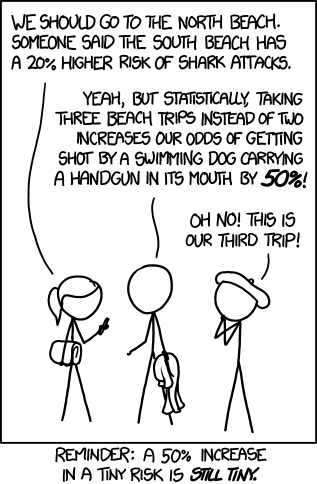
Lying with percentages
If you really really want to misuse statistics, use percentages. It’s the easy way to hide what’s actually happen.
First, let’s consider a group of somethings. It doesn’t matter if they are cars, candy bars, or rock stars. I won’t give them names other than letters from the alphabet, { A, B, C, D, E, F }. Now I conduct a phone survey to see which ones are the most popular. Each person gets to pick one, or say “None of the Above”. I call 1,000 people, and everyone picks at least one thing.
| Thingy | Absolute amount |
| A | 400 | | B | 75 | | C | 50 | | D | 25 | | E | 25 | | F | 10 | | “None” | 15 | | | | | TOTAL | 1000 |
If I report those numbers, people can clearly see what’s going on. They know the sample size. I can hide the sample size with statistics, which is the first way to hide methodology. Statisticians, the real sort, like to talk about representative samples. You need a certain number of people to say something interesting about a question.
| Thingy | Percentage |
| A | 40% | | B | 7.5% | | C | 5% | | D | 2.5% | | E | 2.5% | | F | 1% | | “None” | 1.5% | | | | | TOTAL | 100% |
Now, I’ll make some statements based on these data, which, based on these data, are accurate statements. Notice the qualification: it’s only based on these data.
- C is twice as popular as D
- B is three times as popular as D
- F is one-fifth as popular as C
- D and E are the same.
Still, these statements are misleading. None of those are popular at all. Thingy A is favored by 40 percent of the people, and everyone else divides up the rest. With small numbers, the relative numbers appear to be important than they really are. It’s not really important which of { B, C, D, F } is more popular because the real story is that they all pale in comparison to { A }.

This isn’t the only problem with small numbers, though. If you’ve seen polls reported, you’ve probably also noted a reported error. In the statistical sampling process, there is always an error involved because you are trying to represent the whole world by only looking at part of it. Let’s assign an error of 5% to my sampling, using the same numbers. If I repeated my sampling, I should get about the same numbers, although the difference between samplings might show a difference in 5% for any Thingy. I’d then expect any particular sampling to have numbers fall in these ranges.
| Thingy | Low | High |
| A | 380 | 420 | | B | 71 | 79 | | C | 47 | 53 | | D | 23 | 27 | | E | 23 | 27 | | F | 9 | 11 | | “None” | 14 | 15 | | | | | TOTAL | 1000 |
So, I run the sample again and get these numbers:
| Thingy | Percentage |
| A | 420 | | B | 71 | | C | 53 | | D | 27 | | E | 23 | | F | 11 | | “None” | 15 | | | | | TOTAL | 1000 |
Do my earlier conclusions still hold? Nope.